 Jason Finance
Where to Park Idle USD and USDT: Bitfinex Lending, Aave, Treasury ETFs and USD Deposits Compared by Opportunity Cost
Where should idle USDT and dollars go? US$100,000 across USD deposits, SGOV, IB01, Aave, Bitfinex lending, Uniswap LP and a Ledger: return and risk.
On this page
- 1.What the tools in this comparison are
- 2.Yield snapshot, September–October 2026
- 2.1APR, APY, YTM and SEC yield are different numbers
- 3.One by one: where the yield comes from and what risk it adds
- 3.1USD time deposit: the simplest benchmark
- 3.2Short-Treasury ETFs (SGOV, IB01): parking dollars in U.S. Treasuries
- 3.3Aave: yield from crypto borrowers
- 3.4Bitfinex lending: the price of leverage demand
- 3.5Uniswap stablecoin LP: fee income and depeg risk
- 3.6USDT on a Ledger: the cost of zero yield
- 4.How to choose: pros, cons and getting your money back
- 4.1Pros and cons at a glance
- 4.2Can you take the money back early, and how is the return calculated?
- 5.Excess yield: turning each layer of risk into dollars
- 5.1How the layers of risk stack up
- 5.2The benchmark rate decides the excess yield
- 5.3Both idle cash and chasing yield have costs
- 6.Isn’t 8–10% about the same as the U.S. stock market?
- 6.1Dollar-cost averaging has a cash-drag cost too
- 7.The five steps I use to decide
- FAQ
Disclosure: this page contains exchange invitation links and codes. If you sign up through them, the exchange may pay Jason Finance a referral commission. It does not raise the fees you pay; the invitation fee discount is set by the exchange. Our ratings follow the published methodology, where the invitation discount counts only toward the fees item.
When you have dollars or USDT you won’t need for a while, the usual question is “where is the yield highest?” I think a better question is: compared with a low-risk dollar benchmark, how much more do I earn for each extra layer of risk I take on?
This post uses US$100,000 as the example and compares a USD time deposit, SGOV, IB01, Aave, Bitfinex lending, a Uniswap stablecoin LP and USDT held on a Ledger, with the S&P 500 as a reference at the end. Every number carries a date. Treat them as a sense of scale at that time, not as returns you will get in the future.
The short answer: on September–October 2026 numbers, short-Treasury ETFs at about 4% are the benchmark that adds almost no extra risk. The extra yield from Aave and Bitfinex lending is payment for carrying USDT, platform, smart-contract and liquidation risk, and money lent on Bitfinex cannot come back until the borrower repays or the term ends.
This post is my personal research and notes, not investment, tax or legal advice. Rates, APY, APR, YTM, ETF yields, protocol parameters and tax rules can all change; the market figures are snapshots from specific dates. Check the latest official information before you act.
What the tools in this comparison are
- SGOV: iShares 0-3 Month Treasury Bond ETF, a BlackRock fund listed on the New York Stock Exchange.
- IB01: iShares $ Treasury Bond 0-1yr UCITS ETF, a BlackRock fund domiciled in Ireland and listed in US dollars on the London Stock Exchange.
- Aave: a decentralized lending protocol on Ethereum and other blockchains. Suppliers put coins into a pool, and borrowers pay interest to take them out.
- Bitfinex: a centralized crypto exchange that offers margin trading and a lending market where you lend funds to margin traders (Margin Funding).
- Uniswap: a decentralized exchange. Liquidity providers (LPs) put two tokens into a pool and earn the fees other people pay when they trade.
- Ledger: a hardware wallet, often called a cold wallet, made by the French company Ledger. The private key stays on the physical device and every transfer has to be confirmed with a button on the device. It protects the key; it does not make the coins earn anything or remove stablecoin risk.
- S&P 500: the Standard & Poor’s 500 Index, compiled by S&P Dow Jones Indices, which tracks 500 large listed U.S. companies.
Yield snapshot, September–October 2026
| Tool | Recent yield | One-year scale on US$100k | Source of the yield | Main added risk |
|---|---|---|---|---|
| Ledger, USDT only | 0% | $0 | None | Tether, blockchain, private key and handling |
| Bank of Taiwan 1-year USD deposit | 2.05% | About $2,050 | Bank interest | Bank credit, liquidity |
| SGOV | 30-day SEC yield 3.70% | About $3,700 | 0–3 month U.S. Treasury bills | ETF, short-term rates |
| IB01 | Weighted average YTM 4.16% | Around $4,000 | 0–1 year U.S. Treasuries | ETF, short-term rates |
| Aave (Ethereum) USDT | About 3.47% snapshot | About $3,470 | Crypto borrowers | USDT, blockchain, smart contract, protocol |
| Uniswap V3 USDC/USDT | About 1.20% snapshot | About $1,200 | Trading fees | Two stablecoins, LP mechanics, smart contract |
| Bitfinex USDT lending | High single digits at times, very volatile | Possibly $6,000–$10,000 or more | Leveraged traders | USDT, exchange custody, lending and liquidation |
| S&P 500 | No APR | Unpredictable | Corporate earnings, dividends, valuation | Equity market risk |
The one-year scale assumes the current rate holds for a year. It is only there to show size, not to forecast.
Economists often treat the U.S. Treasury rate as the risk-free rate: the return investors can get while taking almost no risk. Compare roughly 3–4% from SGOV and IB01 with the 6–10% Bitfinex USDT lending has shown at times, and the gap is the risk premium. What you take on for it is USDT itself, the chance that Bitfinex fails or freezes withdrawals, and lending and liquidation risk; the market pays you the difference in rates for carrying them.
APR, APY, YTM and SEC yield are different numbers
These figures are often compared side by side, but they are calculated differently:
- APR (annual percentage rate): usually without compounding. Bitfinex lending quotes APR.
- APY (annual percentage yield): usually includes compounding. Aave and other DeFi dashboards show APY, and it is a floating market rate; a 5% APY today does not lock in 5% for a year.
- YTM (yield to maturity): IB01 publishes a weighted average YTM, which reflects the bond portfolio’s yield at current prices, coupons and maturities. It is not a bank deposit rate. When the short bonds mature the fund reinvests, so if market rates fall, the fund’s yield falls with them over time.
- 30-day SEC yield: a standardized yield measure for U.S. funds, and the one SGOV publishes.
So IB01’s 4.16% and SGOV’s 3.70% use different definitions, and you cannot read them as IB01 earning exactly 0.46% more.
One by one: where the yield comes from and what risk it adds
Below, from lowest to highest risk, is where each tool’s return comes from and what it adds on top of a USD deposit.
USD time deposit: the simplest benchmark
Bank of Taiwan’s posted USD rates on 30 September 2026 were about 2.05% for one year and 2.10% for large one-year deposits. On US$100,000 that is about $2,050 a year.
A deposit’s rate is written into the contract, there is no ETF price movement, and there is no stablecoin or smart-contract risk. The trade-off is that the rate was below short Treasuries at the time, the money is less flexible during the term, and breaking the deposit early can reduce the interest.
Short-Treasury ETFs (SGOV, IB01): parking dollars in U.S. Treasuries
SGOV holds 0–3 month U.S. Treasury bills. Its 30-day SEC yield on 1 October 2026 was 3.70%, with an expense ratio of 0.09%, and you can buy it at U.S. brokers such as Firstrade. IB01 holds 0–1 year U.S. Treasuries; its weighted average YTM on 24 September 2026 was 4.16%, with a total expense ratio of 0.07%, and it trades in US dollars on the London Stock Exchange.
Both work more like a cash parking spot inside a brokerage account than the long-term bond investment most people picture. With short rates around 4%, US$100,000 earns about $4,000 a year, but the rate is not locked: as Treasuries mature the fund rolls into new ones, so the yield drifts down after rate cuts. The only added risks are the ETF itself and changes in short-term rates, which makes this the closest thing to “risk-free dollars” in this comparison.
The main difference between them is structure: SGOV is U.S.-domiciled and pays monthly, while IB01 is Irish-domiciled and accumulating. For non-U.S. investors this affects U.S. estate tax, withholding on distributions and, for Taiwan tax residents, when overseas income is realized. The details are in IB01 vs SGOV: choosing a short-term USD Treasury ETF.
Aave: yield from crypto borrowers
You supply USDT to an Aave lending pool, borrowers take it and pay interest, and you receive the APY. The yield comes from crypto borrowers’ demand, not from U.S. Treasury interest.
A recent DefiLlama snapshot showed Aave V3 Ethereum’s USDT supply APY at about 3.47%, with roughly US$3.0 billion supplied. Around the same time, on 7 October 2026, DefiLlama’s USDT reference supply APY was about 5.58%. The two don’t conflict: protocol, chain, market, utilization and timing all differ, which shows that USDT lending APY is not a fixed rate. If one market pays 3.47% now, US$100,000 earns about $3,470 a year; at 5.2% for a while, about $5,200. Neither is locked for a year.
Main risks:
- Tether as issuer, and depegging
- Ethereum and other blockchains
- Aave smart contracts
- Oracles
- Collateral and liquidation
- Bad debt in extreme conditions
- Withdrawal liquidity in the pool
If you only supply and do not borrow, you generally have no health-factor liquidation of your own, but the protocol risks above remain. Connecting a Ledger to Aave protects only the private key and signing; it does not turn your Aave position into cold storage.
Bitfinex lending: the price of leverage demand
You put USDT into Bitfinex’s lending market, lend it to margin traders, and they pay interest to you. The lending rate is, at heart, the price of crypto leverage demand.
FRR is not a fixed rate
Bitfinex’s FRR (Flash Return Rate) is based on active fixed-rate loans, weighted by amount, and updated every hour. When leverage demand rises the rate can rise, and when the market cools it can fall. A 9% annual rate does not mean 9% locked for a year.
The fee is 15% of interest
According to Bitfinex’s fee page, the standard funding-provider fee is 15% of interest earned, and 18% for hidden offers. Bitfinex’s interest calculation works out to amount × rate × time × (1 − fee).
For a gross rate of 9.33%: 9.33% × 85% ≈ 7.93%, or about $7,930 a year on US$100,000. That assumes the gross rate holds all year, the funds are always lent out, and nothing sits idle.
A September 2026 snapshot
Stratum, which tracks Bitfinex’s public funding statistics, showed USDT FRR at a gross annual rate of about 8.79% in early September 2026, and USD at about 11.32%. 8.79% × 85% ≈ 7.47%, or about $7,470 a year on US$100,000. That is a historical snapshot, not a current or future guarantee.
The risk is not in the daily price
- USDT and Tether
- Exchange custody
- Withdrawals, platform operations and regulation
- Tail risk in margin liquidations
- Falling rates and reinvestment risk
Borrowers post collateral and can be liquidated, which reduces ordinary default risk, but that does not guarantee no losses in every extreme market.
What Bitfinex says about liquidation tail risk
Borrowers must first put collateral in their margin wallet, and losses on their positions are covered by it; when the account’s net value falls below the maintenance margin, the position is liquidated automatically. In What are the risks associated with offering funding?, Bitfinex says the risk of lending is low because of how its risk engine is designed, but it also describes an extreme case: if prices move so fast that forced liquidations cannot be matched in the order book, Bitfinex slows liquidations down, and that can still leave margin traders losing more than their collateral. Up to a point Bitfinex covers those losses; if prices move so sharply that most margin positions fall below zero, losses will eventually be shared with funding providers.
The official Bitfinex blog (5 December 2025) says margin lenders have never suffered losses in Bitfinex’s 13 years of operation, including the 2020 COVID crash, the 2021 Evergrande crisis and the 2022 Luna collapse. The same post says that in theory, lenders could incur losses if prices change dramatically. It has not happened so far, which does not mean it cannot. Borrowers can also repay early: once a 10% loan ends, the next one might pay only 5%, so the return you actually get over a year will differ from the rate you see today.
The loss profile of this kind of yield looks like “steady interest most of the time, with a few extreme events that can cause large losses.” A balance that doesn’t move day to day is not proof of low risk.
Bitfinex has charged no spot trading fees since December 2025. For the cost of converting between USDT and dollars there, see Bitfinex USDT to USD.
Exchanges’ own flexible earn products are the same kind of yield. OKX Simple Earn and its VIP-only Auto Earn both lend USDT to borrowers and margin traders, and OKX keeps 15% of the interest; the details and my actual earnings screenshots are in the OKX review.
Uniswap stablecoin LP: fee income and depeg risk
A USDC/USDT liquidity pool earns trading fees, not borrowing interest. A recent DefiLlama snapshot showed the Uniswap V3 Ethereum USDC-USDT 0.01% pool at about 1.20% APY with about US$34.25 million locked; another USDC-USDT pool on V4 was about 1.31%. In this snapshot the nominal yield was below short Treasuries at around 4%.
The main added risks are two stablecoin issuers (USDT and USDC), Ethereum, Uniswap’s smart contracts, managing a concentrated-liquidity range, and how your position shifts in a depeg. If USDT falls to $0.90 while USDC stays at $1, arbitrageurs can put the weaker USDT into the pool and take out the stronger USDC, so your position ends up more and more concentrated in the coin that depegged.
USDT on a Ledger: the cost of zero yield
A hardware wallet such as a Ledger keeps the private key on a device in your own hands, so the coins are not held by an exchange or a protocol. USDT on a Ledger, not connected to DeFi, not in an LP and not on an exchange, earns 0%.
That removes Bitfinex custody, Aave protocol risk and Uniswap LP risk, but it keeps Tether issuer and depeg risk, blockchain risk, seed-phrase and private-key risk, and the risk of mistakes when signing or sending.
With short Treasuries at 4% as the benchmark, US$100,000 on a 0% Ledger has an opportunity cost of about $4,000 a year. Ledger isn’t charging you $4,000; you are giving up that yield in exchange for removing a few layers of exchange and protocol risk.
If you want a Ledger, buy it directly from Ledger’s official store so you don’t end up with a second-hand or unknown device that someone may have tampered with. You can use this link to go to the official Ledger store.
How to choose: pros, cons and getting your money back
Pros and cons at a glance
| Tool | Pros | Cons and main risks |
|---|---|---|
| USD time deposit | Rate written into the contract; no price movement; no stablecoin or smart-contract risk | Rate below short Treasuries at the time; money less flexible during the term; breaking it early can reduce interest |
| SGOV, IB01 | Return comes from U.S. Treasuries; low expense ratios (0.09%, 0.07%) | Rate not locked and falls after rate cuts; non-U.S. investors need to watch structure and tax differences |
| Aave USDT supply | Return comes from crypto borrowers; no liquidation of your own if you only supply | Floating APY; Tether, blockchain, smart-contract, oracle, bad-debt and pool-liquidity risk |
| Bitfinex lending | High single-digit annual rates at times when leverage demand is high; no daily price movement | Rate changes hourly and a 15% fee applies; exchange custody, USDT and liquidation tail risk; borrowers can repay early |
| Uniswap stablecoin LP | Return comes from trading fees, not borrowing interest | Snapshot yield below short Treasuries; two stablecoin issuers and LP mechanics; in a depeg the position concentrates in the weaker coin |
| Ledger, USDT only | Removes exchange custody and protocol risk | No yield; still Tether, blockchain, private-key and handling risk |
| S&P 500 | Historical annual returns above the interest-based tools here | Not interest; returns come from earnings and valuation, and prices can swing a lot on any day |
This table summarizes the sections above and is not a recommendation of any tool. Which one fits depends on when you will need the money and which extra layers of risk you are willing to carry.
Can you take the money back early, and how is the return calculated?
Beyond the rate, how quickly you can get the money back and how interest builds up are practical differences when choosing.
| Tool | Can you take it back early? | How the return is calculated and paid |
|---|---|---|
| USD time deposit | You can break the deposit, but interest is usually reduced under the bank’s rules | Interest at the contract rate, paid at maturity |
| SGOV | Sell on the market any time during trading hours | Monthly distribution; the price creeps up between distributions as interest accrues and drops on the ex-dividend date, in a sawtooth pattern |
| IB01 | Sell any time during London Stock Exchange hours | No distributions; interest accumulates in the NAV, so the price rises fairly smoothly |
| Aave | Withdraw any time, except when the pool is almost fully borrowed and withdrawals temporarily fail | Interest accrues continuously and the supplied balance grows over time |
| Bitfinex lending | Offers not yet taken can be cancelled; once taken, you cannot recall the funds | Interest per second for the time actually lent, credited daily around 01:30 UTC, minus the 15% fee |
| Uniswap stablecoin LP | Remove liquidity any time | Fees build up in the position; the mix of the two coins you get back may differ from what you put in |
| Ledger, USDT only | Send any time (on-chain fee applies) | No yield |
| S&P 500 | Sell an ETF any time during trading hours | No interest; return is price change plus dividends |
SGOV’s sawtooth price: you don’t lose the interest by selling before the payout
SGOV pays monthly, but interest builds up in the fund’s NAV every day. The price creeps up between distributions and steps down on the ex-dividend date when the payout goes out, which looks like a sawtooth. So if you sell before the distribution, the interest accrued so far is broadly reflected in the price you get; missing a payout by a few days doesn’t mean those days earned nothing. IB01 is accumulating and has no ex-dividend step, so its price line is smoother. See IB01 vs SGOV for the full comparison.
Bitfinex lending: once lent, you wait for repayment
When you lend on Bitfinex you set a maximum period, from 2 to 120 days. According to Bitfinex, once your funding is taken, only the borrower, or the system when the period ends, can close it; the lender cannot take it back. The borrower can repay at any time before the end, and you earn interest only for the time the funds were actually lent. In the worst case, money put into Bitfinex lending comes back only when the period you set runs out, so it is not the place for money you may need urgently.
Aave: withdraw any time, if there is liquidity to withdraw
Aave’s pools let suppliers withdraw their tokens with accrued interest, as long as the pool still has unborrowed funds. The most you can withdraw is total supply minus total debt; if utilization nears 100%, withdrawals temporarily fail until borrowers repay or new deposits arrive. You can normally withdraw at any time, but when markets are tense and everyone is borrowing, that is exactly when you might not be able to.
Excess yield: turning each layer of risk into dollars
Excess yield = investment yield − short-Treasury benchmark
Assume the short-Treasury benchmark is 4%:
| Where the money sits | Simplified assumption | One-year return | Versus 4% Treasuries |
|---|---|---|---|
| Ledger USDT | 0% | $0 | −$4,000 |
| USD time deposit | 2.05% | $2,050 | −$1,950 |
| Short Treasuries | 4.0% | $4,000 | Benchmark |
| Aave | 4.5% | $4,500 | +$500 |
| Bitfinex lending (after fee) | 7.5% | $7,500 | +$3,500 |
| Hypothetical equity return | 10% | $10,000 | +$6,000 |
The last row is only arithmetic, not a forecast for the S&P 500.
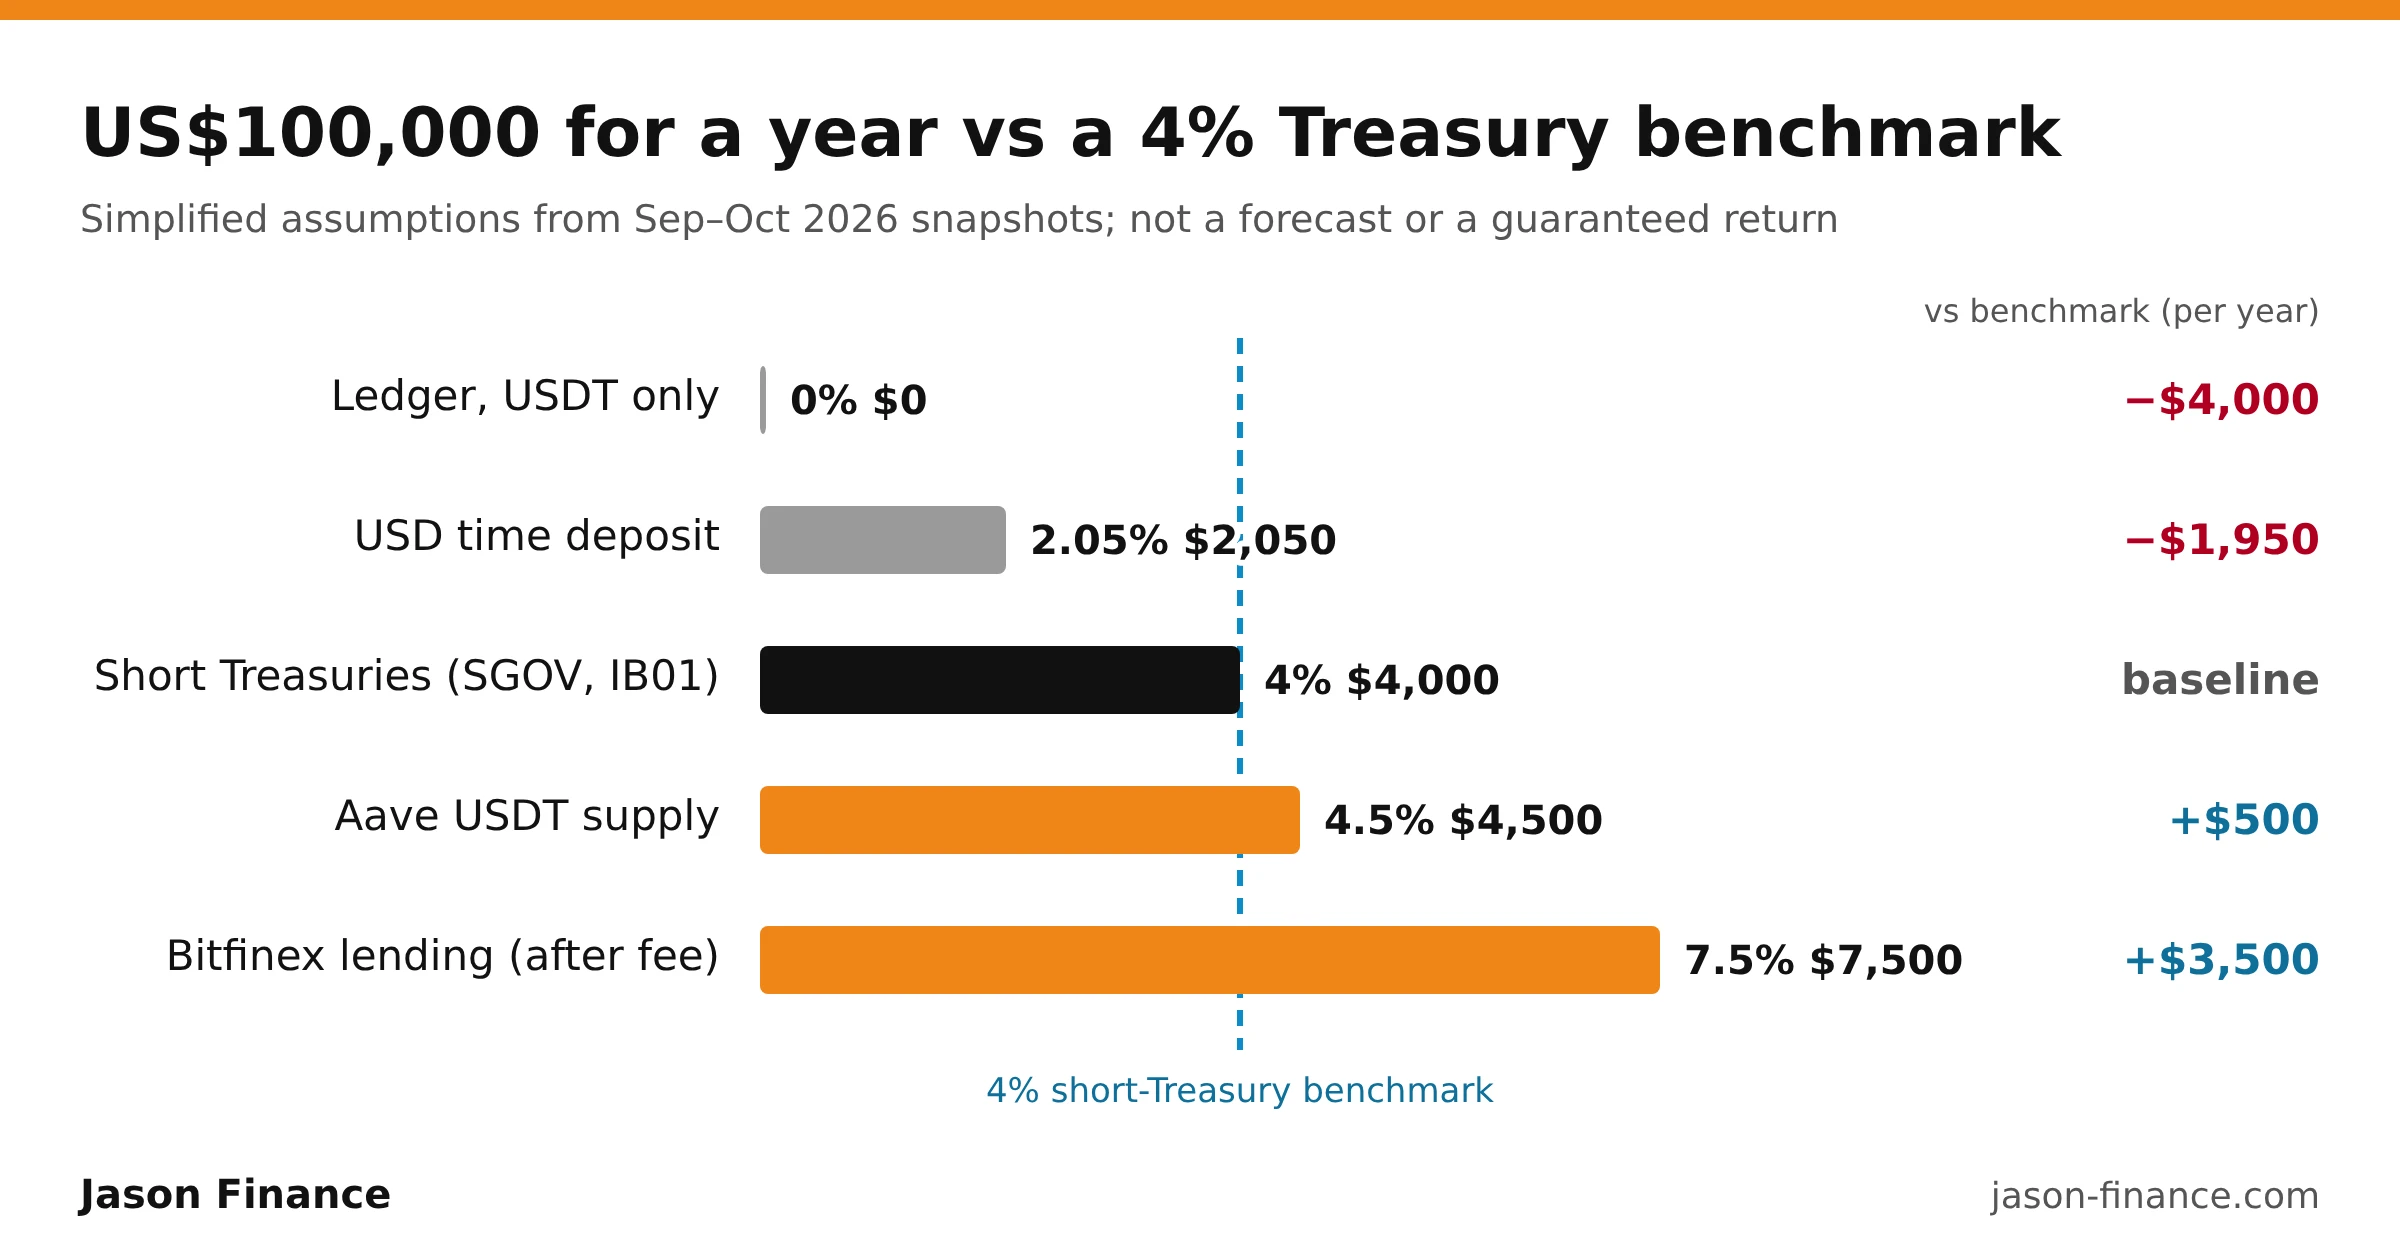
Drawn from the simplified assumptions in the table above, without the hypothetical equity row.
Seen this way, the question changes from “Aave pays 4.5%, is that good?” to “am I willing to add USDT, blockchain, smart-contract, oracle and protocol risk for an extra $500 a year?” Likewise, if Bitfinex lending nets 7.5% after fees, the extra $3,500 is the risk premium to weigh against exchange custody, stablecoin, lending-market and operational risk.
How the layers of risk stack up
| Tool | Risk stack |
|---|---|
| USD time deposit | USD → bank |
| IB01 | USD → Irish UCITS ETF → U.S. Treasuries |
| SGOV | USD → U.S.-domiciled ETF → U.S. Treasuries |
| Ledger USDT | USD value → USDT → Tether → blockchain → private key |
| Aave | USD value → USDT → Tether → Ethereum → Aave smart contracts → collateral, oracles, liquidation |
| Bitfinex lending | USD value → USDT → Tether → Bitfinex custody → lending market → leveraged traders and liquidation |
| Uniswap LP | USD value → USDT and USDC → two issuers → Ethereum → Uniswap → LP mechanics |
| S&P 500 | USD → equity market → companies → earnings, valuation, economic cycle |
The benchmark rate decides the excess yield
If Treasuries pay 0.5% and DeFi pays 5%, the excess yield is 4.5%; if Treasuries pay 4% and DeFi 4.5%, it is only 0.5%. The same “DeFi 4.5%” can mean a very different opportunity cost. So whenever you see a crypto APY, first ask: what does short-term dollar cash pay today without any protocol risk?
Both idle cash and chasing yield have costs
US$100,000 in 0% cash while short Treasuries pay about 4% has an opportunity cost of about $4,000 a year, or about $10.96 a day. That is why T-bills, money market funds, SGOV and IB01 are used as cash-management tools.
Going the other way, moving US$100,000 from Treasuries to DeFi to go from 4.0% to 4.5% adds only $500 a year, about $1.37 a day, while adding wallet management, gas fees, token approvals, stablecoin and smart-contract risk, protocol monitoring, and more complicated tax records.
Isn’t 8–10% about the same as the U.S. stock market?
The percentages look close, but where the return comes from and how it is distributed are completely different.
S&P Dow Jones Indices data as of 31 August 2026, S&P 500 price return:
| Period | Return |
|---|---|
| 1 year | 18.98% |
| 3 years, annualized | 19.47% |
| 5 years, annualized | 11.19% |
| 10 years, annualized | 13.48% |
| 10-year annualized risk | 15.35% |
These are historical results, not a future APR. Stock returns come from earnings growth, dividends and changes in valuation; Bitfinex lending is borrowers’ interest minus the platform fee; Aave is the borrowing rate; Treasuries are interest paid by the U.S. government. So 8% and 10% can’t be compared on the number alone.
Stock risk shows up in the price every day, and moves of +25% or −20% can both happen. Lending and DeFi can look calm for long stretches while carrying tail events such as an exchange failure, a smart-contract hack or a stablecoin depeg. Judging crypto lending as safe because “volatility has been low” can underestimate that tail risk.
Dollar-cost averaging has a cash-drag cost too
If you already have US$100,000 but invest about $8,333 a month and are fully invested only after a year, only part of the money is in the market on average during that first year. So even if you assume the market rises a smooth 10% for the year, you can’t simply calculate $100,000 × 10% = $10,000. The S&P 500’s historical annualized return is not the annualized return of your dollar-cost-averaged portfolio. It is another opportunity cost, accepted to reduce the timing risk of investing all at once.
Tool
Want to see how monthly investing in the U.S. market would have grown in its worst, median and best historical periods? Try my index DCA calculator: enter a monthly amount and see the results.
Try the calculatorThe five steps I use to decide
- Find the short-Treasury or low-risk dollar benchmark.
- Work out each tool’s excess yield over that benchmark.
- List the risks added to earn that excess yield.
- Convert the excess yield into actual dollars.
- Decide whether that risk premium is enough to pay for the added risk and complexity.
Every yield is payment for something. Bank interest pays you for letting the bank use your money and giving up some liquidity. Treasury yields pay you for lending dollars to the U.S. government for a time. Aave’s yield comes from crypto borrowers, and suppliers carry stablecoin, blockchain, smart-contract and protocol risk. Bitfinex lending comes from leveraged traders’ demand for funds, and lenders carry exchange custody, platform and tail risk. Stock returns come from owning the residual claims on companies and living with market swings. A cold wallet pays nothing because you have deliberately removed several layers of intermediary risk.
An APR is not a free return. What is worth comparing is how much more the market pays you for each extra layer of risk.
FAQ
Is the Bitfinex lending rate fixed?
No. Bitfinex's FRR is updated every hour from active loans and reflects how much leveraged traders want to borrow. In early September 2026 USDT showed a gross annual rate of about 8.79%, but that was a snapshot, not a rate locked for a year.
What fee does Bitfinex charge on lending?
According to Bitfinex, the standard fee for funding providers is 15% of the interest earned, or 18% for hidden offers. A gross rate of 9.33% becomes about 7.93% after the 15% fee, and only if the funds stay lent out all year.
Is supplying USDT on Aave safe?
Aave's yield comes from crypto borrowers, not from U.S. Treasury interest. If you only supply and do not borrow, you generally face no liquidation of your own, but you still carry Tether, blockchain, smart-contract, oracle and bad-debt risk.
Does holding USDT on a Ledger cost anything?
USDT on a Ledger earns 0%. Against a short-Treasury benchmark of about 4%, US$100,000 gives up roughly US$4,000 a year. That is the price of removing exchange custody and protocol risk.
How is excess yield calculated?
Excess yield is the investment's yield minus the short-Treasury benchmark. With Treasuries at 4% and Aave at 4.5%, the excess yield is 0.5%, or about US$500 a year on US$100,000.

Jason
Account Manager in Google Large Customer Sales and Columbia MBA admit, sharing the money tools and experience he actually uses.
Comments
Sign in with Google to comment. Your comment will not show your Google profile picture or name; it appears under a randomly generated nickname to protect your privacy.
By signing in you agree to this site's privacy policy.